Africa Mining Watch




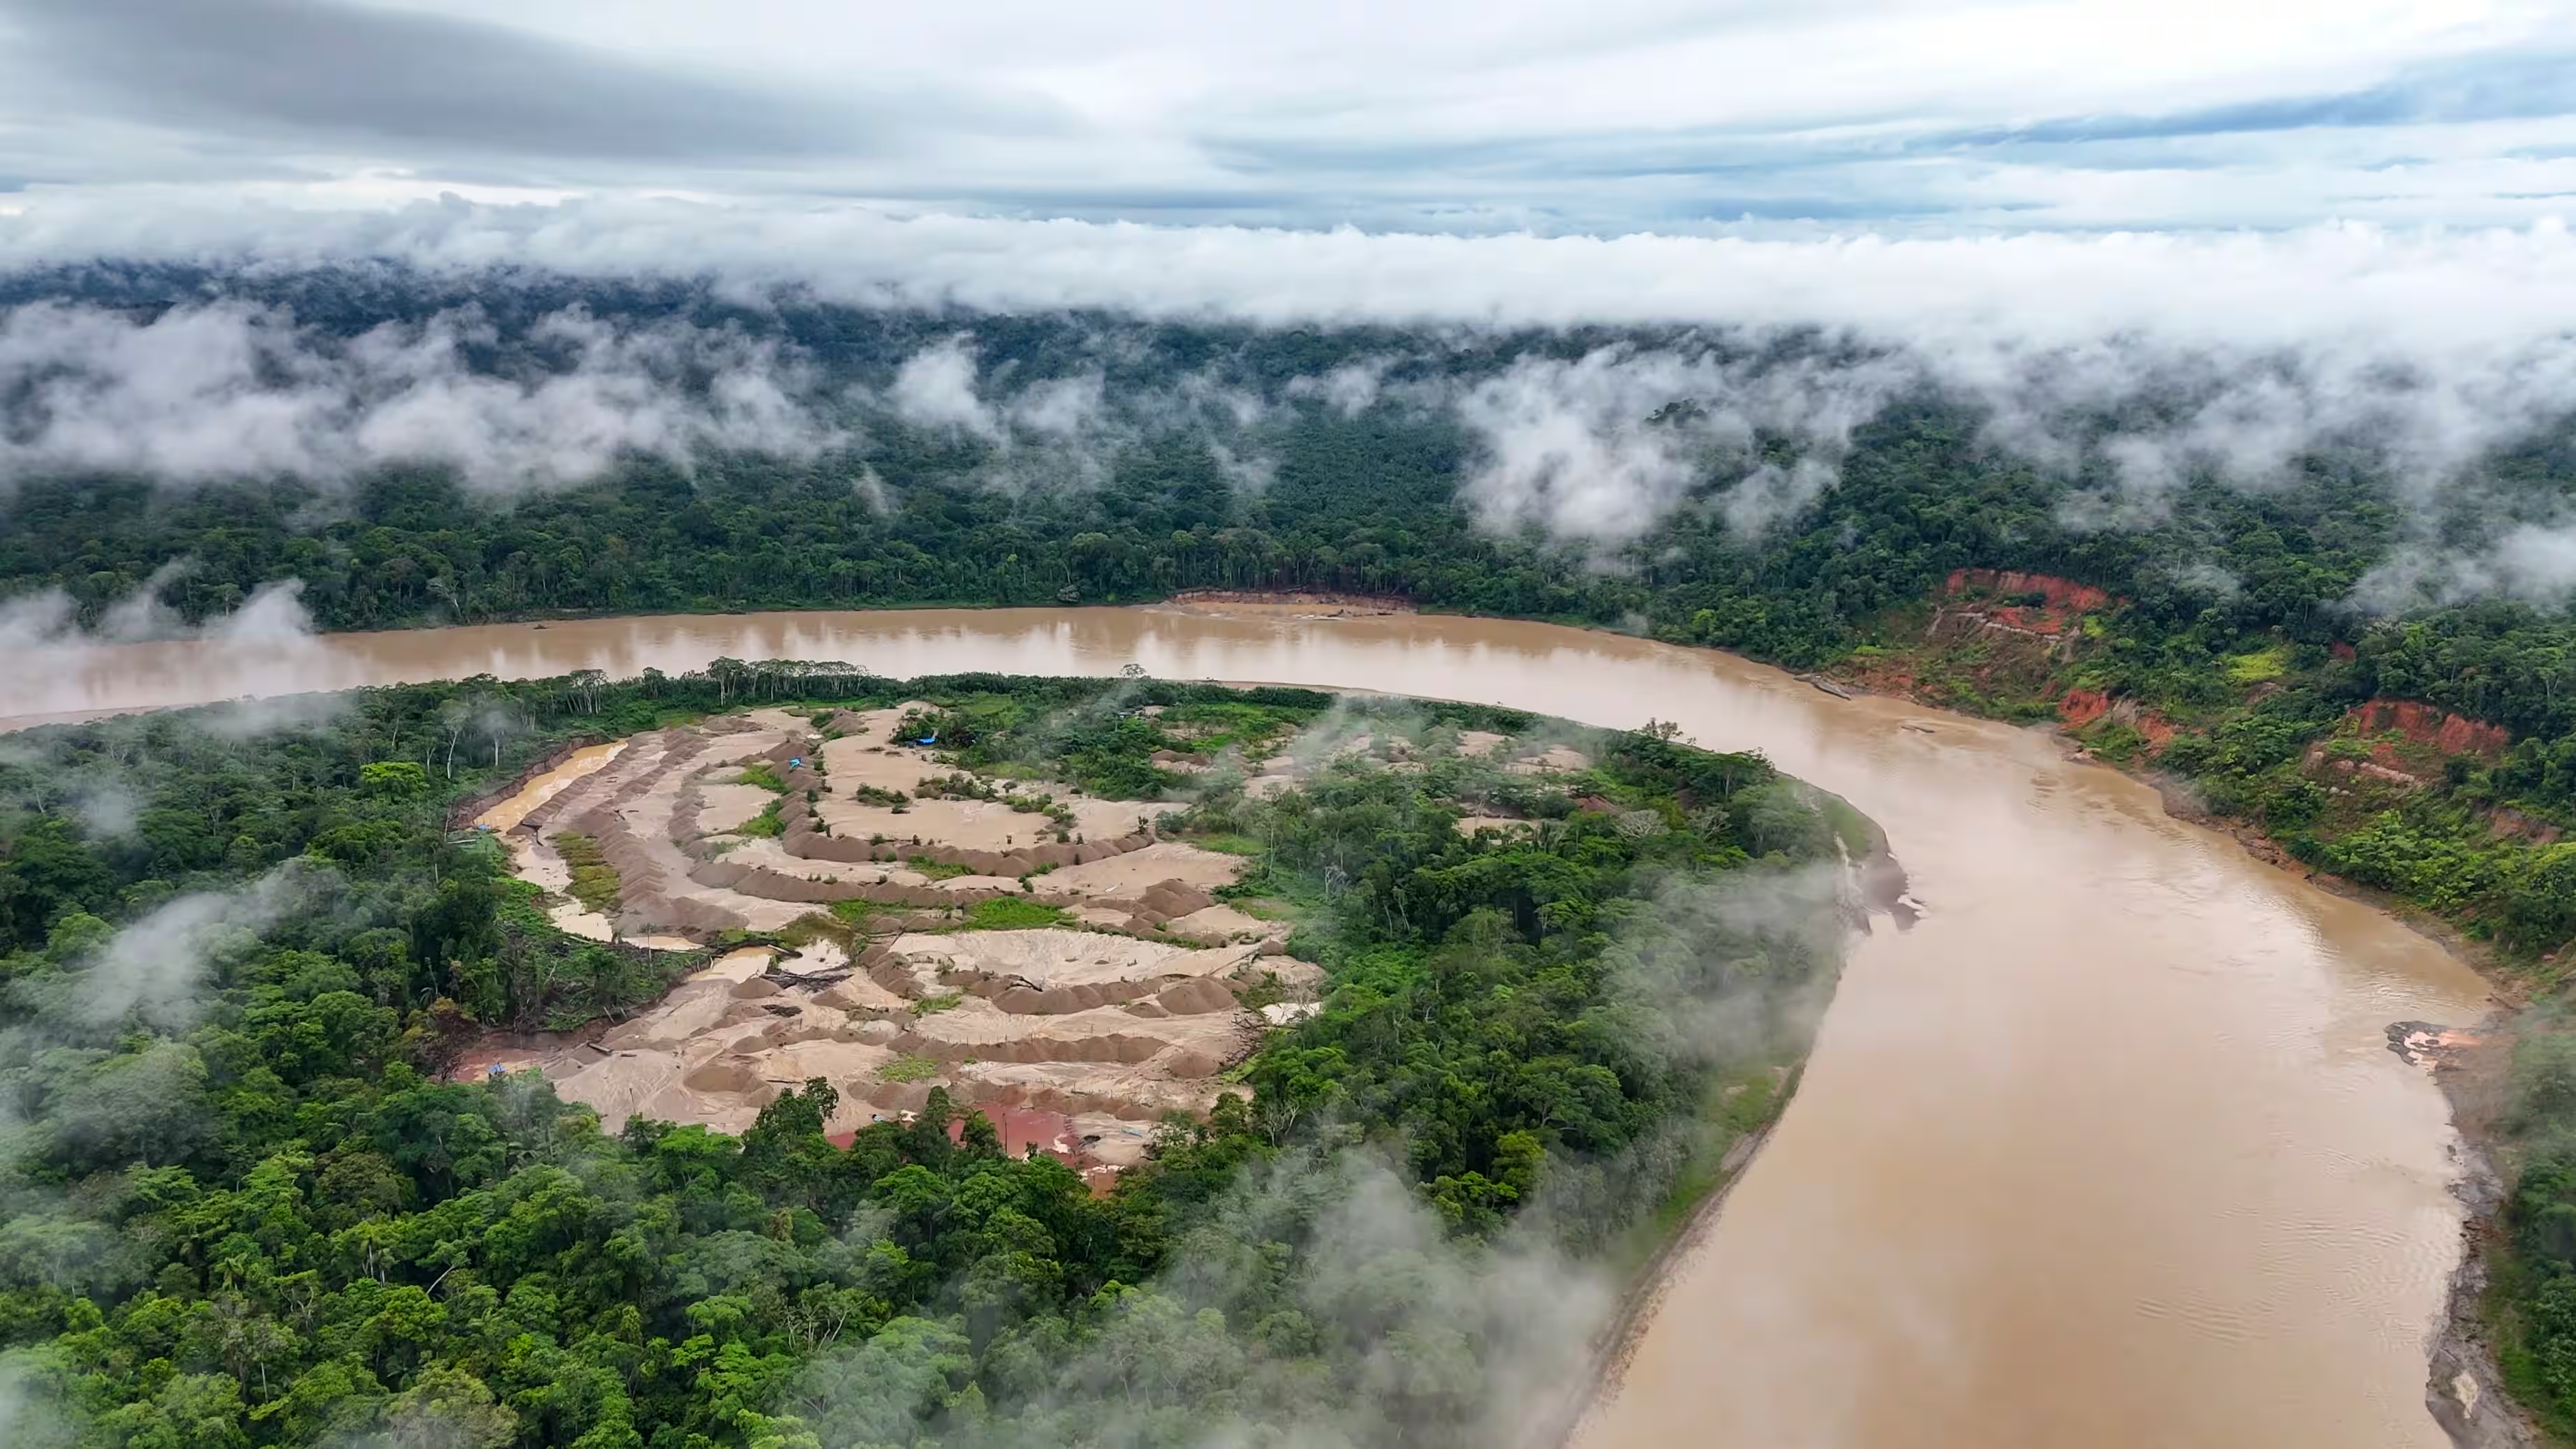
A first satellite sweep of 13 countries in West Africa and the Congo Basin found mining scars in all of them.
- 123,541mining detections
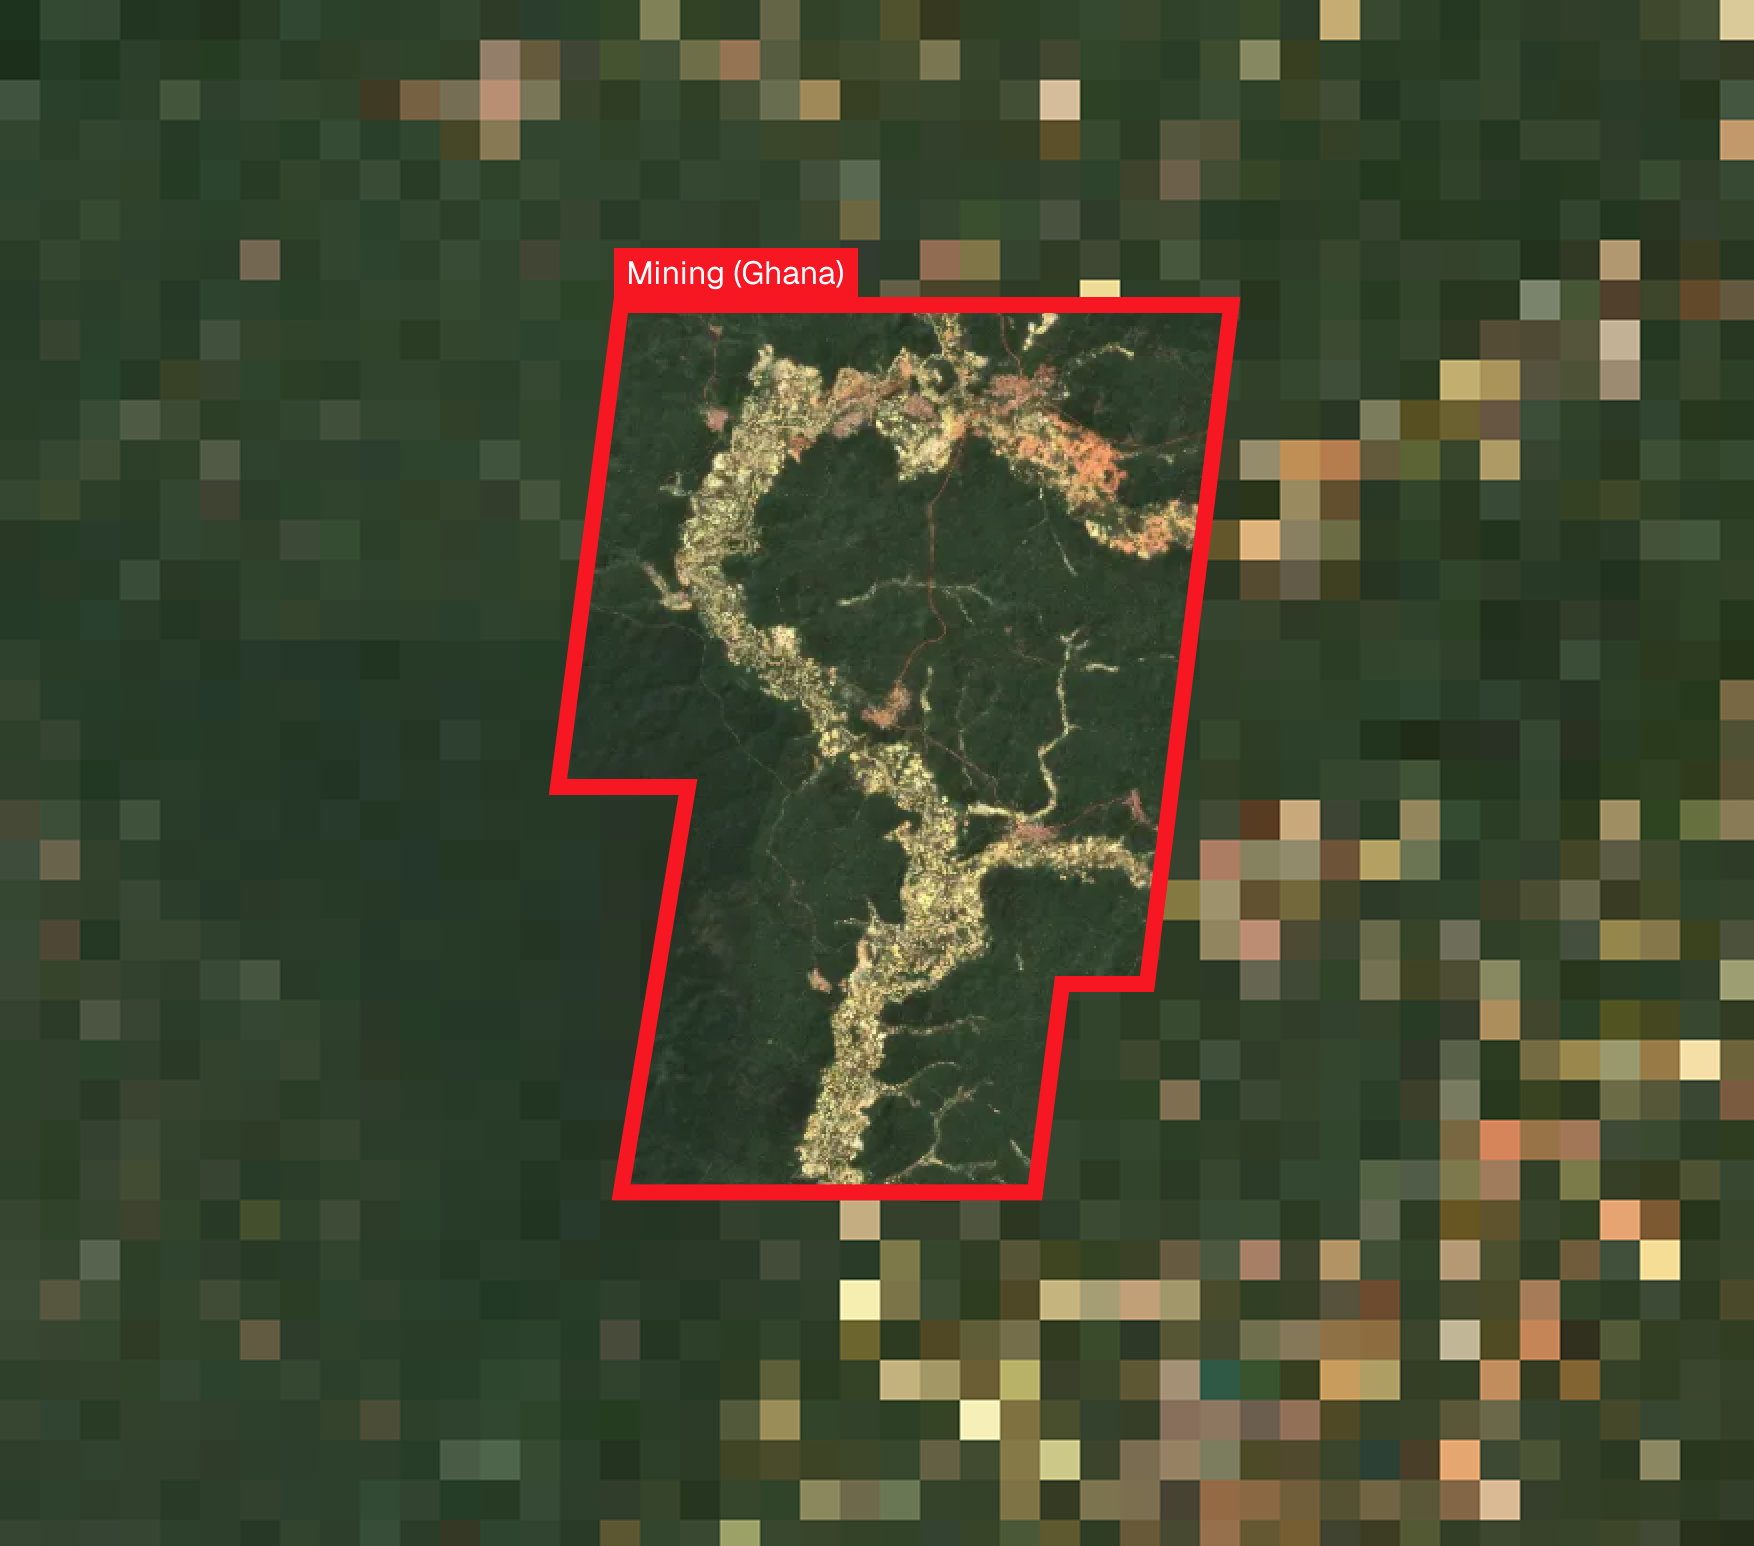
- Each one is a cell of about 320 m — roughly 10.2 hectares — where the models found bare, mined-looking ground.
- 615districts carry detections
- About one in six of the 3,587 administrative areas surveyed, and they turn up in every one of the 13 countries.
- 54%of it sits in 20 districts
- The activity is not spread evenly. Over half of everything the survey found falls inside twenty administrative areas.
- 1 in 13detections is on protected land
- More than 150 protected areas carry detected mining — forest reserves, Ramsar wetlands and the Okapi Wildlife Reserve, a World Heritage site, among them.
How to read these numbers. They come from Earth Index models reading satellite imagery to June 2026, across 6,079,621 km² of West Africa and the Congo Basin. A detection is disturbed ground that looks like mining from orbit — it is not a register of mines, it carries no date, and it does not separate licensed operations from illegal ones. Quarries, cleared farmland and abandoned workings can look alike from above. Explore the map and the underlying tables below.
Access our data
This data is a rough cut, produced by a collection of machine learning models in Earth Index based on research initiated at the Africa Mining Watch Mapathon. You can access the data here. The map broadly reflects the state of artisanal mining activity in West Africa and the Congo Basin.
Though it is not the focus of the survey, the data captures some industrial mining facilities, and it includes errors both in false detections and mining sites missed. We recommend using the data primarily for exploration of mining hotspots and to validate findings independently.
Where mining meets protected land
9,828 detections — 8% of everything the survey found — fall inside a protected area. They are spread across 200 of the 1,941 protected areas in the surveyed countries: forest reserves, Ramsar wetlands, national parks and World Heritage sites. Sort by any column, or narrow to one country or one kind of designation.
200 protected areas
| Rank | Protected area | |||
|---|---|---|---|---|
| 1 | Réserve partielle de faune de kankanRamsar Site · Guinea · since 2002 | 23,294 ha of 16,494 km² | 1.4% | |
| 2 | Oda RiverForest Reserve · Ghana · since 1939 | 6,449 ha of 168 km² | 38.3% | |
| 3 | Niger-Niandan-MiloRamsar Site · Guinea · since 2002 | 6,005 ha of 13,991 km² | 0.4% | |
| 4 | Upper WassawForest Reserve · Ghana · since 1925 | 4,578 ha of 136 km² | 33.6% | |
| 5 | ApampramaForest Reserve · Ghana · since 1952 | 2,113 ha of 37 km² | 57.0% | |
| 6 | Réserve de faune à okapisWorld Heritage Site · DR Congo · since 1996 | 1,896 ha of 13,940 km² | 0.1% | |
| 7 | OkapisWildlife Reserve · DR Congo · since 1992 | 1,896 ha of 13,940 km² | 0.1% | |
| 8 | IssiaClassified Forest · Côte d'Ivoire | 1,839 ha of 668 km² | 2.8% | |
| 9 | TanoeClassified Forest · Côte d'Ivoire | 1,336 ha of 331 km² | 4.0% | |
| 10 | Classified Forest Name Unknown (CIV) No.16Classified Forest · Côte d'Ivoire | 1,734 ha of 1,471 km² | 1.2% | |
| 11 | Subin ShelterbeltForest Reserve · Ghana · since 1940 | 1,202 ha of 24 km² | 49.9% | |
| 12 | Neung SouthForest Reserve · Ghana · since 1954 | 1,443 ha of 131 km² | 11.0% | |
| 13 | TinkissoRamsar Site · Guinea · since 2002 | 1,443 ha of 12,290 km² | 0.1% | |
| 14 | Bia TawyaForest Reserve · Ghana · since 1965 | 1,378 ha of 543 km² | 2.5% | |
| 15 | Fure RiverForest Reserve · Ghana · since 1939 | 880 ha of 159 km² | 5.5% | |
| 16 | Bonsa RiverForest Reserve · Ghana · since 1932 | 914 ha of 164 km² | 5.6% | |
| 17 | Anhwiaso EastForest Reserve · Ghana · since 1926 | 801 ha of 122 km² | 6.5% | |
| 18 | Tano NimriForest Reserve · Ghana · since 1935 | 595 ha of 207 km² | 2.9% | |
| 19 | Asenanyo RiverForest Reserve · Ghana · since 1938 | 529 ha of 259 km² | 2.0% | |
| 20 | Subri RiverForest Reserve · Ghana · since 1949 | 633 ha of 592 km² | 1.1% | |
| 21 | ManzanClassified Forest · Côte d'Ivoire | 548 ha of 141 km² | 3.9% | |
| 22 | Supuma ShelterbeltForest Reserve · Ghana · since 1938 | 469 ha of 27 km² | 17.3% | |
| 23 | Bili-UereHunting Area · DR Congo · since 1974 | 534 ha of 32,792 km² | <0.1% | |
| 24 | FarangbaiaForest Reserve · Sierra Leone · since 1948 | 522 ha of 230 km² | 2.3% | |
| 25 | DiambarakrouClassified Forest · Côte d'Ivoire | 420 ha of 415 km² | 1.0% |
Bars are scaled to the largest site in the current view and follow whichever column is sorted, so they compare like with like. Ranking by detections favours the largest sites: Kankan is 16,494 km² and 1.4% affected, while Oda River is 168 km² and over a third mined — the share of the site column is the one that separates them. Where designations overlap, a detection is credited to each boundary that contains it but counted once in the total, so the detections column sums to 10,280 rather than 9,828. Proposed sites, marine areas, UNESCO-MAB biosphere reserves and protected areas recorded only as a point rather than a boundary are left out. Hectares are the dissolved ground the detection cells cover, so they are an upper bound on disturbance rather than a measure of mined ground. Protected areas from the World Database on Protected Areas. Analysis by Code for Africa and Earth Genome (CC BY 4.0).



Africa Mining Watch Mapathon
African Mining Watch Knowledge Toolkit

From the team behind Amazon Mining Watch